Tuesday, May 26, 2015

Economy teetering

After recessionary Q1, the US economy has been stalling: No growth but no sharp recession either.

ECRI weekly growth that gave real time warning of Q1 is at essentially 0%:


US Growth Barometer is searching for direction:


Credit spread is also unchanged since the sharp drop:

Container volume is now flat yoy. The sharp drop in the beginning of the year is attributed to port strikes but the backlog sure was cleared quickly!

Thursday, April 30, 2015

Tight employment - FED yield normalization ahead

Wage inflation is picking up:

Record job openings
Record job openings

Unemployment claims at pre-recession low

Wage cost up 2.6% yoy
Wage inflation is the most important forward looking inflation measure. FED surely is keeping a close eye on this. If the trend continues, 0% interest rates will soon be history.

Monday, April 27, 2015

NYSE margin debt still trending down

NYSE margin debt hit new all-time high in March. Normalized to GDP, the margin debt is still below the February 2015 peak. In all of last year, the margin debt really has not gone anywhere and the margin relative to SP500 has actually declined. This pattern is similar to prior stock peaks where the margin debt relative to SP500 declined at market top. I attribute this to professional investors lowering their exposure while dumb money continues to invest through the peak.

NYSE margin debt relative to SP500 and GDB

Monday, April 20, 2015

Decision time in economy

The US data has been weak in Q1 2015. Below is the final US Hard Data Index for first three months in 2015. The numbers are weak. Typically this is only seen in recession. It is possible though that the growth rebounds in Q2. Is this likely?

Hard Data Index vs SP500


The US Growth Barometer shown below is giving real time (daily) peak into how economy is developing. Currently, the index is forming a triangle indicating indecision. I will be following closely which way the index turns next. Stay tuned!

US Growth Barometer is forming a wedge

Tuesday, April 7, 2015

Non-existent correlation on DHI share price and median house sale price


Just published a piece an Seeking Alpha on DHI valuation. In response to comment about DHI share price and median house share price, the correlation is almost non-existent.


What if economic problems are structural, not monetary?

The job openings for February is out. There are 5,133,000 open jobs in US. This is the highest in 14 years:


There is no argument about underemployment. Many part timers would like to have a full time job. At the same time, job openings go unfilled. This is a structural problem. Peoples skills do not match the available jobs or they are not willing to relocate for a job.

Given the structural issues, perhaps there is not as much slack in the economy as FED thinks. Perhaps US economy is a +2% growth donkey and not +4% race horse. This may be as good as the economy can possibly get and no amount of whipping with 0% interest can make the donkey go faster.


Thursday, April 2, 2015

Update on economic indicators

This week brought us new data points on vehicle sales, PMI, and factory orders. With this data, the final average for February is complete and we have advance estimate for March:


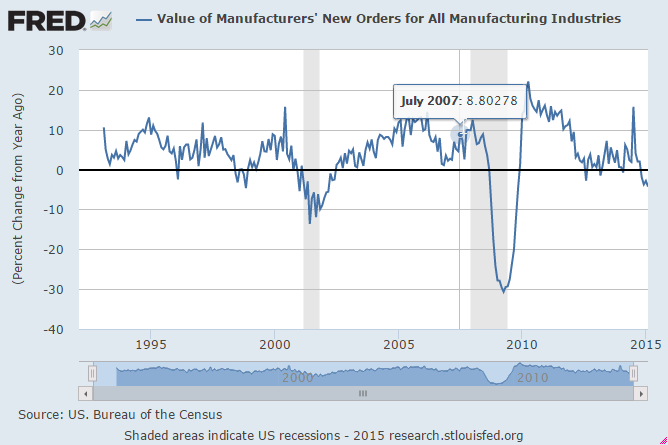
The data looks weak. Especially factory orders are in the recessionary range:

Other areas such as vehicle sales and construction show some weakness but are still growing yoy. Overall, economy is much weaker than stock market. This is also seen in the US Growth Barometer: 


How long can the divergence between economic data and stock market continue? Short answer is that the stocks go up as long as there is price momentum but the momentum may be fading. Below is the plot of SP500 and RSI. Notice the similarity of current situation to prior tops. The divergence between RSI and price is now extended beyond the prior peaks.


Tuesday, March 31, 2015

Leading indicators lagging?

Dallas FED came out today and it was decidedly negative:


The negative economic data is not surprising given the overall economic weakness combined with low oil prices hitting Texas especially hard. But the data is in odds with the leading index for Texas from FRED:

Texas Manufacturing Outlook Survey

The leading indicator is showing upward sloping curve with no hint of weakness. One explanation for the divergence is that leading indicators use monetary signals such as credit spread and yield curve as their components and these monetary signals are now heavily manipulated by FED. It is possible the leading indicators will not be as useful as in the past in predicting the next recession. Proceed with caution.