Tuesday, May 26, 2015

Economy teetering

After recessionary Q1, the US economy has been stalling: No growth but no sharp recession either.

ECRI weekly growth that gave real time warning of Q1 is at essentially 0%:


US Growth Barometer is searching for direction:


Credit spread is also unchanged since the sharp drop:

Container volume is now flat yoy. The sharp drop in the beginning of the year is attributed to port strikes but the backlog sure was cleared quickly!

Thursday, April 30, 2015

Tight employment - FED yield normalization ahead

Wage inflation is picking up:

Record job openings
Record job openings

Unemployment claims at pre-recession low

Wage cost up 2.6% yoy
Wage inflation is the most important forward looking inflation measure. FED surely is keeping a close eye on this. If the trend continues, 0% interest rates will soon be history.

Monday, April 27, 2015

NYSE margin debt still trending down

NYSE margin debt hit new all-time high in March. Normalized to GDP, the margin debt is still below the February 2015 peak. In all of last year, the margin debt really has not gone anywhere and the margin relative to SP500 has actually declined. This pattern is similar to prior stock peaks where the margin debt relative to SP500 declined at market top. I attribute this to professional investors lowering their exposure while dumb money continues to invest through the peak.

NYSE margin debt relative to SP500 and GDB

Monday, April 20, 2015

Decision time in economy

The US data has been weak in Q1 2015. Below is the final US Hard Data Index for first three months in 2015. The numbers are weak. Typically this is only seen in recession. It is possible though that the growth rebounds in Q2. Is this likely?

Hard Data Index vs SP500


The US Growth Barometer shown below is giving real time (daily) peak into how economy is developing. Currently, the index is forming a triangle indicating indecision. I will be following closely which way the index turns next. Stay tuned!

US Growth Barometer is forming a wedge

Tuesday, April 7, 2015

Non-existent correlation on DHI share price and median house sale price


Just published a piece an Seeking Alpha on DHI valuation. In response to comment about DHI share price and median house share price, the correlation is almost non-existent.


What if economic problems are structural, not monetary?

The job openings for February is out. There are 5,133,000 open jobs in US. This is the highest in 14 years:


There is no argument about underemployment. Many part timers would like to have a full time job. At the same time, job openings go unfilled. This is a structural problem. Peoples skills do not match the available jobs or they are not willing to relocate for a job.

Given the structural issues, perhaps there is not as much slack in the economy as FED thinks. Perhaps US economy is a +2% growth donkey and not +4% race horse. This may be as good as the economy can possibly get and no amount of whipping with 0% interest can make the donkey go faster.


Thursday, April 2, 2015

Update on economic indicators

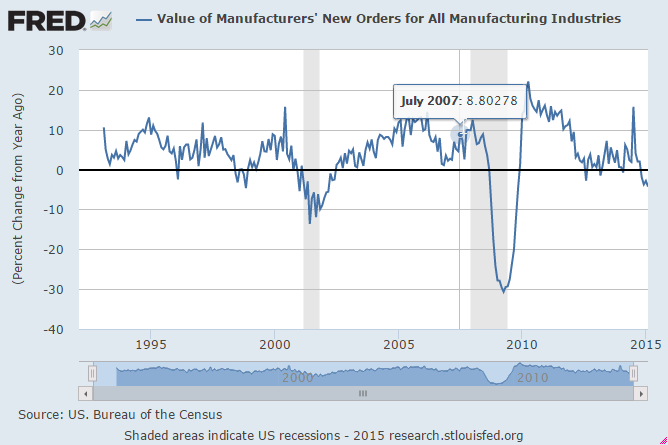
This week brought us new data points on vehicle sales, PMI, and factory orders. With this data, the final average for February is complete and we have advance estimate for March:


The data looks weak. Especially factory orders are in the recessionary range:

Other areas such as vehicle sales and construction show some weakness but are still growing yoy. Overall, economy is much weaker than stock market. This is also seen in the US Growth Barometer: 


How long can the divergence between economic data and stock market continue? Short answer is that the stocks go up as long as there is price momentum but the momentum may be fading. Below is the plot of SP500 and RSI. Notice the similarity of current situation to prior tops. The divergence between RSI and price is now extended beyond the prior peaks.


Tuesday, March 31, 2015

Leading indicators lagging?

Dallas FED came out today and it was decidedly negative:


The negative economic data is not surprising given the overall economic weakness combined with low oil prices hitting Texas especially hard. But the data is in odds with the leading index for Texas from FRED:

Texas Manufacturing Outlook Survey

The leading indicator is showing upward sloping curve with no hint of weakness. One explanation for the divergence is that leading indicators use monetary signals such as credit spread and yield curve as their components and these monetary signals are now heavily manipulated by FED. It is possible the leading indicators will not be as useful as in the past in predicting the next recession. Proceed with caution. 


Friday, March 27, 2015

Coincident and leading data for US economy is weak

This week, we had update on durable goods and housing. With the latest data points, the "hard data" average for the US economy is weak:


This type of weakness is normally associated with recession. It is still early to make this conclusion: Recession is "pervasive weakness" and a few months of below average or negative growth is not yet pervasive. On the other hand, we have ECRI leading indicator also pointing to future weakness:


Finally, the US growth barometer has stabilized but is still divergent from stock market:


Stocks remain near all time high but the backdrop is negative. It will not take much the cause a waterfall declines.


Tuesday, March 24, 2015

OECD Leading Indicators for January

The OECD Composite Leading Indicators for January are out. Below are results for the world's four biggest economies. Notably, only US is growing but loosing steam.

OECD Leading Index for US, China, Japan, and Germany

This indicator is not telling us anything we don't already know. World economy is experiencing slowdown as has been signaled by commodities and Baltic Dry Index:


The current economic expansion has been artificially boosted by bringing future demand forward. This course may be reaching its limits. 


Monday, March 23, 2015

Credit spread is increasing again

After a counter rally, the credit spread has been increasing again:

Credit spread and SP500
While the stocks made new highs last week on FED euphoria, the worsening credit spread signals newly arisen risk aversion. Granted, the divergence between the credit spread and SP500 has persisted longer than I expected but eventually the correlation will be established. For more about why credit spread matters, see "Why credit spread matters".


Friday, March 20, 2015

Economy looks real bad for Q1 2015

Economic data has been weak in recent months. Figure below shows how coincident economic indicators are overwhelmingly deteriorating:

There is a lot of data in this figure - taking the average shows a clearer picture:

The acceleration has been fast. The effect is also seen in the FED forecast for Q1 GDP:


Market is sheering all these negative developments. There is not even a pretense that price movements are driven or related to fundamentals other than short term interest rate. But bulls have only price momentum only on their side, the price may quickly snap down.


Thursday, March 19, 2015

Households still piling into stocks

The Q4 2014 flow of funds data is available from FRED and it shows that households are still moving from bonds into stocks at record pace:

Flow of funds: Households rotating from bonds into stocks

Historically, households have been dumb money: For example, households sold stocks at 2009 bear market bottom and bought bonds. This time may not be any different. If economy continues to decelerate, bonds will outperform stocks. 


Friday, March 13, 2015

I was wrong

Its been obvious for a while: my call on market peak on 12/16/14 was wrong. Since then, all major indexes have made new highs.

I was early but tide may be turning. This week saw a modest sell-off but nothing resembling panic selling. That will surely follow as it becomes obvious that US economy is not immune to global slowdown. Signs are becoming more evident:

ECRI weakly growth is stuck at -4%

Inventories to sales ratio is at recessionary levels: 


The producer price index is at level that has only been seen in recessions: 


Finally, insiders are bailing out (source: Nautilus Research):

So although I was wrong in December, I still believe that a larger correction is coming and it may just be a few weeks away. 

Thursday, March 12, 2015

BDI about to roll over?

Baltic Dry Index has bounced in the recent weeks. This has given some support to shippers’ stock prices but the lift may be short lived: As Figure 1 shows the bounce is seasonal and about to roll over.  I am bulk shippers as prices are low compared to book values; but with the industry bleeding money and China slowing fast, it is prudent to wait.

Seasonal variations of Baltic Dry Index (BDI)
Figure 1: Seasonal variations of Baltic Dry Index

Friday, March 6, 2015

Correlation between ECRI leading index and stock market

The ECRI weekly leading index growth and SP500 change track each other as shown in the plot below.
Correlation between ECRI LEI and SP500
Figure 1: Correlation between ECRI LEI and SP500

The correlation is good, nearly 80%. This is not a surprising given that

1. SP500 is a component of ECRI.

2. Stock market usually reacts to other components of ECRI. For example, higher unemployment claims indicates cooling economy which drives stocks prices lower.

What is surprising is that this correlation has been broken recently. Whereas the ECRI growth has been negative, the SP500 has been making new highs. Similar broken correlations are seen other historically reliable indicators such as credit spread and SP500.

There is combination of forces at play:

1. Investors are betting that current weak data is passing and will not affect longer term prospects of US economy.

2. We are in later stages of bull market where majority of investors are all in. By definition of all in, there are no sellers, just buyers, and price keeps going up.

3. Stocks bubble is being blown by the central bank narrative. In this narrative, fundamental analysis is not important and good news may actually be undesirable.

At the same time, the rally is running on fumes. As seen by the margin debt peaking (plot below), there is little fuel left for further rally. All that is needed for sell off is a slight change in psychology where minority of investors decides to hold cash rather than stocks yielding less than 2% dividends.

Margin debt peaks and SP500
Figure 2: Margin debt has peaked and is in down trend.


Monday, March 2, 2015

All time highs with weak breath

February saw a powerful risk-on rally with stocks. Notably cyclical sectors and broad market rallied reversing some of the defensive posture that has been building. This has resolved some of the glaring divergences in market. I was expecting the divergences to be resolved by pull back in large caps but for now, it is still a bull market.

So divergences remain: The credit spread is still flashing red (HYG/TLT), 1/VIX is still in the downtrend, and new highs/lows signal weakness at ATH. The market is weaker than the headline number suggests.


Monday, February 23, 2015

Slowing global trade and US economy

The collapse of Baltic Dry Index and commodity price indexes are well documented. BDI is at historic lows and and CRB is at levels last seen in recession.

Baltic dry index and CRB commodity index


Both point to rapid deceleration of global and especially Chinese demand. Less attention is given US trade that is rapidly slowing. The exports are down which is natural given the global weakness:


More ominously, imports are also down:


Container volume in west coast ports is down:

Container volumes at Port of Long Beach

Overall, the picture painted by the trade numbers is negative. With leading indicators also down, 2015 may be less strong for US economy than predicted.


Thursday, February 19, 2015

SP500 making new all time highs with weakening global economy

Greece and Ukraine are capturing news headlines while smaller news point to continuing global economic slowdown. First, the US growth barometer is still showing weakness despite a small bounce in oil prices:


This weakness is confirmed by ECRI weekly leading index:
The weakness in materials also shows in inflation which is at levels only seen in recessions:


Baltic Dry Index that measures the cost of bulk shipping is at historic lows:


Despite this backdrop, SP500 is making new highs. For time being, stocks have decoupled real economy and main news moving the market are related to FED interest rates. 


Friday, February 6, 2015

Credit spread recovering but not enough

Market is still trading in the range but internals have recovered a bit. Enough to reverse the bear course?

The credit spread below shows stabilization and a small uptick; however, the stock market is not confirming. The chart shows two other instances of credit spread leading the stock market down, recovering a bit but stock price fails to make new highs. Subsequently, the downtrend was quickly established for both. The lesson here is important. Unless stocks can quickly establish leadership here, we will likely start making lower lows.

Credit spread and stock market.
Figure 1. Credit spread and stock market.
Figure 2. Shows the ECRI weekly leading index. It continues to show weakness. It is worth noting that SP500 is a component of ECRI LEI and LEI is down even with SP500 holding up. If the stock market starts loosing altitude, the ECRI LEI will follow.

Figure 2. ECRI LEI and stock market


Tuesday, February 3, 2015

Realities do not matter

It is clear that the market will go higher in absence of negative news. The following news could have been perceived as negative but they did not affect the market:

  1. War in Europe (Ukraine) and Russia annexing its neighboring territory unilaterally. 
  2. Recession in Japan. 
  3. Slowing growth in China. 
  4. Eurozone deflation. 
  5. The most negative earnings guidance for SP500. 
  6. Plummeting commodity prices signaling global slowdown. 
  7. Almost total collapse of the world’s 9th largest economy (Russia). 
  8. Utter collapse of Baltic Dry Index again indicating global slowdown. 
It is obvious that stock market has decoupled from realities. Equally obvious is that it is hard to predict when the reality will catch up with the market. The rising volatility, however, indicates that the market is on borrowed time.

Monday, February 2, 2015

Down, Down, Up, Down, Up

The last five trading days: SPY down 1.3%, down 1.3%, up 1%, down 1.2%, up 1.3%. In this context, today's action is not at all bullish but just another example of market confusion. Remainder: Stocks have decoupled from fundamentals such as geopolitical news or global economy. This is seen in the breakdown between US Growth Barometer and stock price:

US Growth Barometer and SP500

Given the breakdown between stock price action and fundamentals, the day-to-day market action is unpredictable. Longer term, the fundamentals will act like gravity on stock prices.